What You Get WithThis Service
Everything included in this service — no upsells, no hidden costs, no surprises. Here’s exactly what you get.
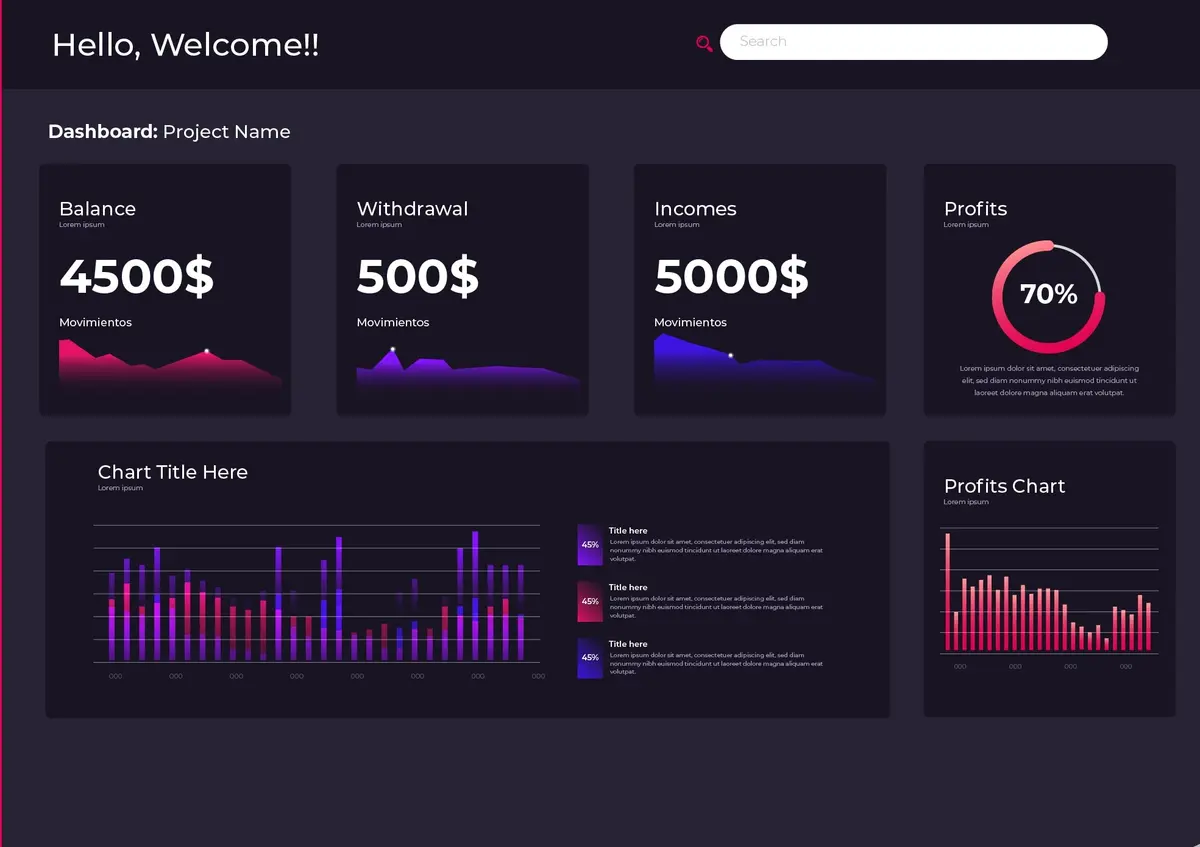
Live dashboards that update automatically as your data changes — sales numbers, customer activity, inventory levels, or operational metrics. See current status without manual refreshes or waiting for overnight reports. Make decisions based on what’s happening now, not yesterday’s numbers.
Custom KPIs tailored to your business — revenue growth, customer acquisition cost, churn rate, inventory turnover, or any metric you track. Built around your decision-making process, not generic templates. Filters and date ranges let you analyze data by time period, product, or customer segment.
Data visualized through interactive charts, graphs, and tables built with Chart.js or D3.js. Click to drill down into details, hover for specific values, and filter by category or time period. Visual format makes trends and outliers immediately obvious compared to spreadsheet rows.
Set up automated reports sent via email daily, weekly, or monthly. Export data as PDF for presentations, CSV for analysis, or Excel for accounting. Stakeholders get the data they need without asking you to pull reports manually. Save hours each week on routine reporting tasks.
Control who sees what data with user permissions (admin sees everything, managers see department data, viewers see high-level summaries). Dashboards work on tablets and phones so you can check metrics on the go. Responsive design means charts and filters adapt to smaller screens.
Don’t Take My Word For It.Test The Code Yourself.
Three live applications deployed on Vercel — e-commerce platform with Stripe payments, file storage SaaS with Appwrite backend, AI travel planner with Gemini integration. Demo credentials included. No sign-up required.
Login as admin, process test orders, upload files, test authentication flows. See exactly what production-ready code looks like before we discuss your project.
Common Questions
Everything you need to know about this service